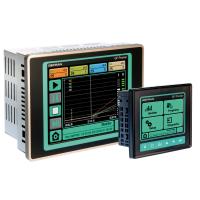
The user interface, based on an LCD TFT colour touch screen (3.5” and 5.7”), is extremely simple to use.
Configuration menus are identified by keys and icons that give immediate access to work program creation pages.
Every program is identifiable with a number and a name, a time base definable in days/hours, hours/min, min/sec, different start and stop strategies. In addition, a number of cyclical repetitions of the program can be set. The programs are in easily scrollable list form and are selected directly on the screen.
The steps are configured the same way with numbers and name, with up to 4 setpoint values for the 4 available loops, and step duration in the time base for the selected program.
Cyclical repetitions of a sequence of contiguous steps can be easily created. To facilitate and speed up programming, there are copy, delete, and add functions for both steps and programs.
When a program has been created, it can immediately be displayed in trend form to intuitively display correctness of the programming.
The program to be run can be selected from the programs list (from screen or digital inputs) and the Monitor page is automatically called up, from which all of the main process data are controlled. The monitor page is divided into two parts and simultaneously shows, in trend form, the trend of controlled variables (at the left of the screen) and of programmed setpoints (on the right).
The data are always based on the real time seen at the center of the page.
The top of the page shows basic data on program name and run state, plus lapsed and remaining time. The monitor page can be adapted to display needs at any time: buttons let you display / hide trend tracks in run-time.
States of enable inputs and event outputs are displayed graphically for each step being run, and the steps are highlighted by name or number on the screen.
Loop engineering scales are independent and each value can be represented on graphs and bar graphs.
The “Hold Back Band” function, independently settable with different values for each step of each loop, checks that the variables trend remains in the defined tolerance “window,” blocking execution of the program if maximum deviation is exceeded.
Bargraph display pages for channels offer immediate data on analog indicators, with different colors to identify heating and cooling phases, and deviation between PV and SP, while a specific bargraph displays output power level.
These pages are also adaptable to the application via buttons, which display zones freely, from 1 to 4.
Under the conditions required, manual variations of setpoint, supplied power, and PID values can be made on the page for each zone.
GF_PROMER provides complete alarms control, with recognition functions, protection of the entire application based on various password levels, and saving of historical data, programs, settings, via USB key.
The choice of “distributed” control architecture makes GF_PROMER affidable, flexible, adaptable to equipment with various performance and modularity requirements.
CONTROLLER
Advanced control algorithms provide excellent management of process variables.
Various types of control are available: ON/OFF, P, PI, PID both only heat or cool and double-action heat+ cool.
In addition, the cool action can be set via indication of the cooling fluid used: air, oil, water.
Calculation of the most appropriate process parameters is extremely rapid and efficient thanks to the use of sophisticated automatic tuning procedures. Advanced tuning lets you check the best PID parameters under all conditions.
ALARMS
Two alarm setpoints (minimum and maximum) for each zone. For each alarm, you can select:
– the control variable to assign to it
– setpoint value
– hysteresis value
– 5 properties (with latch, disable at switch- on, normal/symmetrical, absolute / deviation, direct/inverse).
You can set LBA, HB, SBR alarms: alarm presence is displayed with an icon and described on the alarms page.

